
Aim
 To describe methods of assessing Flushes and Springs habitat relevant to deer managers.*
Habitat description
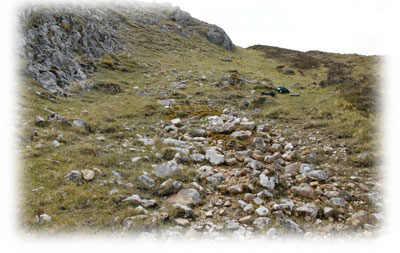
Flushes & Springs are where ground water seeps or springs from a hillside. Some are acid and some are ‘base rich’ (that is rich in minerals such as lime). Flushes and springs support a number of rare small plants: sedges, rushes, herbs, liverworts and mosses (see species list). Where the water is very lime rich deposits of tufa (porous rock) may form with associated mosses. Springs are usually large enough for a square (2m x2m) plot. Flushes are generally narrower, requiring a 1m x 4m plot.


Flushes & Springs species:
Bristle sedge/ Carex microglochin
Sheathed sedge/ Carex vaginata,
Mountain scurvygrass/ Cochlearia micacea Two-flowered rush/ J. biglumis
Chestnut rush/J. castaneus
Three-flowered rush/ J. triglumis
False sedge/ Kobresia simpliciuscula
Iceland purslane/ Koenigia islandica
Scorched alpine-sedge/ Carex atrofusca
Alpine rush/ Juncus alpinoarticulatus
Scottish asphodel/ Tofieldia pusilla
Cratoneuron/ Cratoneuron spp
Purple saxifrage/ Saxifraga oppositifolia
Mossy saxifrage/ S. hypnoides
Yellow saxifrage/ S. aizoides
Alpine saxifrage/ S. nivalis
Starry saxifrage/ S. stellaris
Key indicators
The main impact that deer have on flushes is trampling1. Direct deer trampling is assessed by the presence of bare soil with deer hoof prints visible.
Other impacts
Flooding may cause flushes to be washed out. Other herbivores such as sheep may also cause trampling impacts.
| What to measure | What to analyse |
| For trampling record bare soil (for flushes) or mosses (for springs) with a deer hoof print in each of the 16 quadrats | For each plot, summarise the frequency** of quadrats with presence or absence of deer hoof prints (for example: 5/16 quadrats, hoof prints PRESENT; 11/16 quadrats, hoof prints ABSENT). For each site, summarise the frequency of quadrats with deer hoof prints present or absent (for example, in a site with 10 plots (a total of 10 x 16 quadrats): 60/160 quadrats, hoof prints PRESENT; 100/160 quadrats, hoof prints ABSENT) |
| Record presence of pulled-up mosses and other plants in each of the 16 quadrats | For each plot, summarise the frequency of quadrats with presence or absence of pulled-up mosses/ plants (for example: 7/16 quadrats, pulled up mosses/ plants PRESENT; 9/16 quadrats, pulled up mosses/plants ABSENT). For each site, summarise the frequency of quadrats with pulled-up mosses/plants present or absent (for example, in a site with 10 plots (a total of 10 x 16 quadrats): 60/160 quadrats, pulled-up mosses/plants PRESENT; 100/160 quadrats, pulled-up mosses/plants ABSENT) |
| Take digital photo of whole plot from fixed point | Will enable detection of changes in vegetation distribution over time |